montgomery county today
121
REGIONAL PLANNING AREA
JOBS-HOUSING RATIO
2010
PROJECTED
JOBS-HOUSING RATIO
2040
Upper Perkiomen Valley Region
1.03
0.95
Indian Valley Region
1.21
1.20
Pottstown Region
0.87
0.85
Central Perkiomen Valley Region
0.92
0.87
Spring-Ford Region
1.61
1.59
North Penn Region
1.67
1.70
Norristown Region
1.19
1.21
Main Line / King of Prussia Region
2.80
2.88
Horsham-Willow Grove Region
2.05
2.09
Ambler Region
1.98
2.01
Conshohocken / Plymouth Meeting Region
2.70
2.77
Eastern Montgomery County Region
1.20
1.20
Montgomery County Total
1.66
1.66
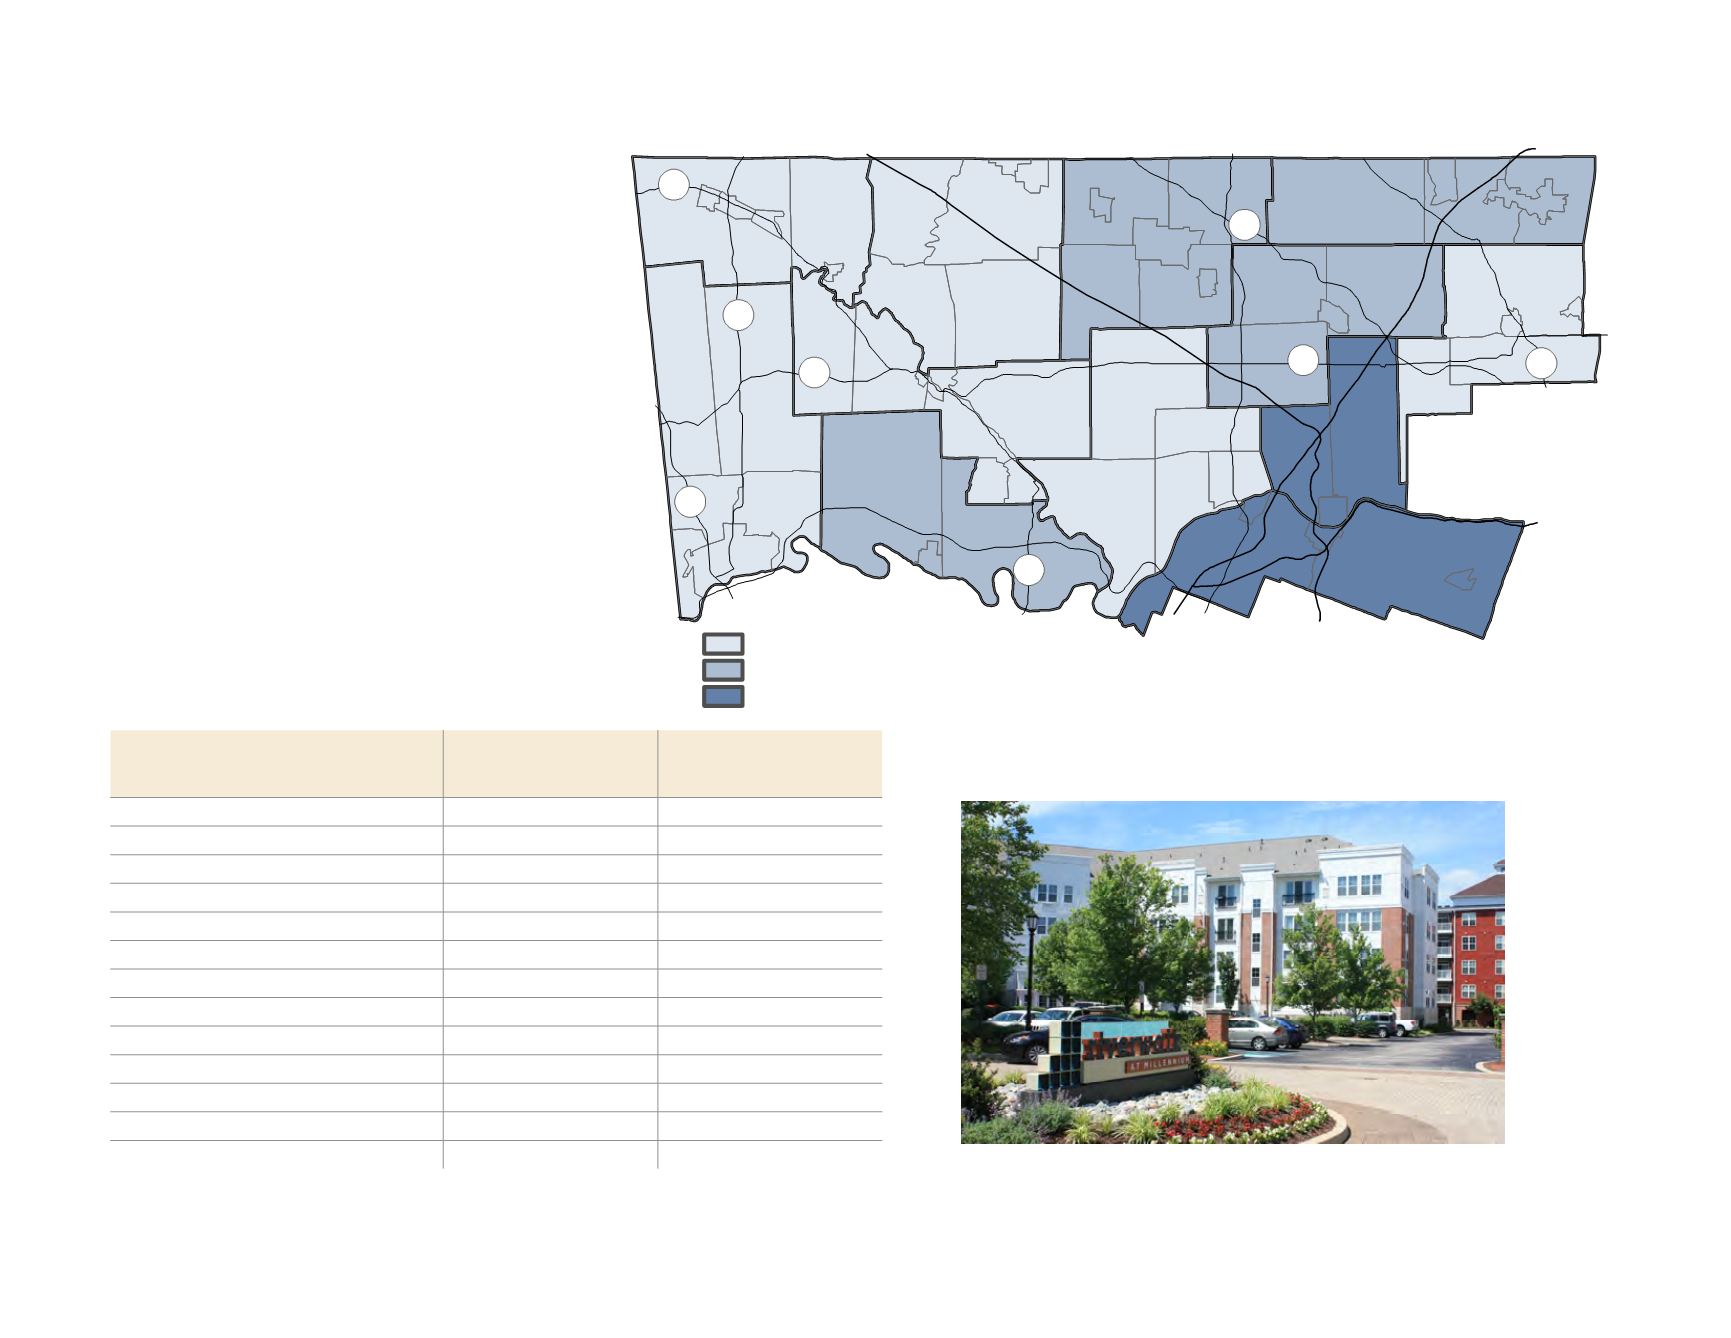
FIGURE 89:
Regional Jobs-Housing Ratios: 2010 and 2040
Projected Regional Jobs-Housing Ratios
Jobs-housing ratios for 2040 are based on current
population and employment projections.
However, municipalities are not predestined to
follow these projections and can change their land
use regulations to affect future growth.
Communities in regions with high ratios can
adjust their policies to allow more housing, while
communities with low ratios can attempt to
encourage more jobs, although this is not always
easy to do.
In 2040, certain regions are expected to have high
jobs to housing ratios, including the Main Line /
King of Prussia and Conshohocken / Plymouth
Meeting regions. Residential uses in office parks,
mixed use districts, and more multifamily
development would provide more housing near
the employment centers in these regions. This
could shorten commuting times and provide
employers with a readily available workforce.
FIGURE 88:
Jobs-Housing Ratios by Regional Planning Area
Dense residential development, such as the Riverwalk at Millennium apartments
in Conshohocken, can help create a healthy balance between jobs and housing.
Indian Valley
North Penn
Pottstown
Area
Norristown
Area
Ambler Area
Spring-Ford
Area
Main Line / King of Prussia
Central Perkiomen Valley
Horsham-Willow Grove
Upper Perkiomen Valley
Eastern
Montgomery
County
Conshohocken /
Plymouth
Meeting
¯
Pottstown
Norristown
Lansdale
Collegeville
Jenkintown
Conshohocken
476
276
76
476
t
u
422
t
u
202
611
100
309
Hatboro
Pennsburg
73
663
29
29
73
Regions with a high ratio of jobs to housing units
Regions with a low ratio of jobs to housing units
Regions with a ratio of jobs to housing units that is similar to the countywide ratio
Sources: U.S. Census Bureau, Delaware Valley Regional Planning Commission
Sources: U.S. Census Bureau, Delaware Valley
Regional Planning Commission


