montgomery county today
119
FIGURE 87:
Special Needs Housing
POPULATION
UNDER 5
YEARS
PERCENT OF
POPULATION
POPULATION
5-17
YEARS
PERCENT OF
POPULATION
POPULATION
18-64
YEARS
PERCENT OF
POPULATION
POPULATION
65 YEARS
AND OVER
PERCENT OF
POPULATION
With a hearing difficulty
295
0.6%
917
0.7%
6,145
1.2%
14,153
12.1%
With a vision difficulty
84
0.2%
610
0.5%
4,770
1.0%
6,174
5.3%
With a cognitive difficulty
—
—
3,134
2.3%
15,256
3.1%
8,172
7.0%
With an independent living
difficulty
—
—
—
—
13,411
2.7%
15,778
13.5%
Total
295
0.6%
4,837
3.6%
32,287
6.5%
33,123
28.3%
With an ambulatory
difficulty
—
—
361
0.3%
16,382
3.3%
19,999
17.1%
With a self-care difficulty
—
—
1,320
1.0%
6,519
1.3%
7,740
6.6%
TOTAL
21,510
11,638
26,562
36,742
15,579
29,189
141,220
TOTAL
PERCENT
15.2%
8.2%
18.8%
26.0%
11.0%
20.7%
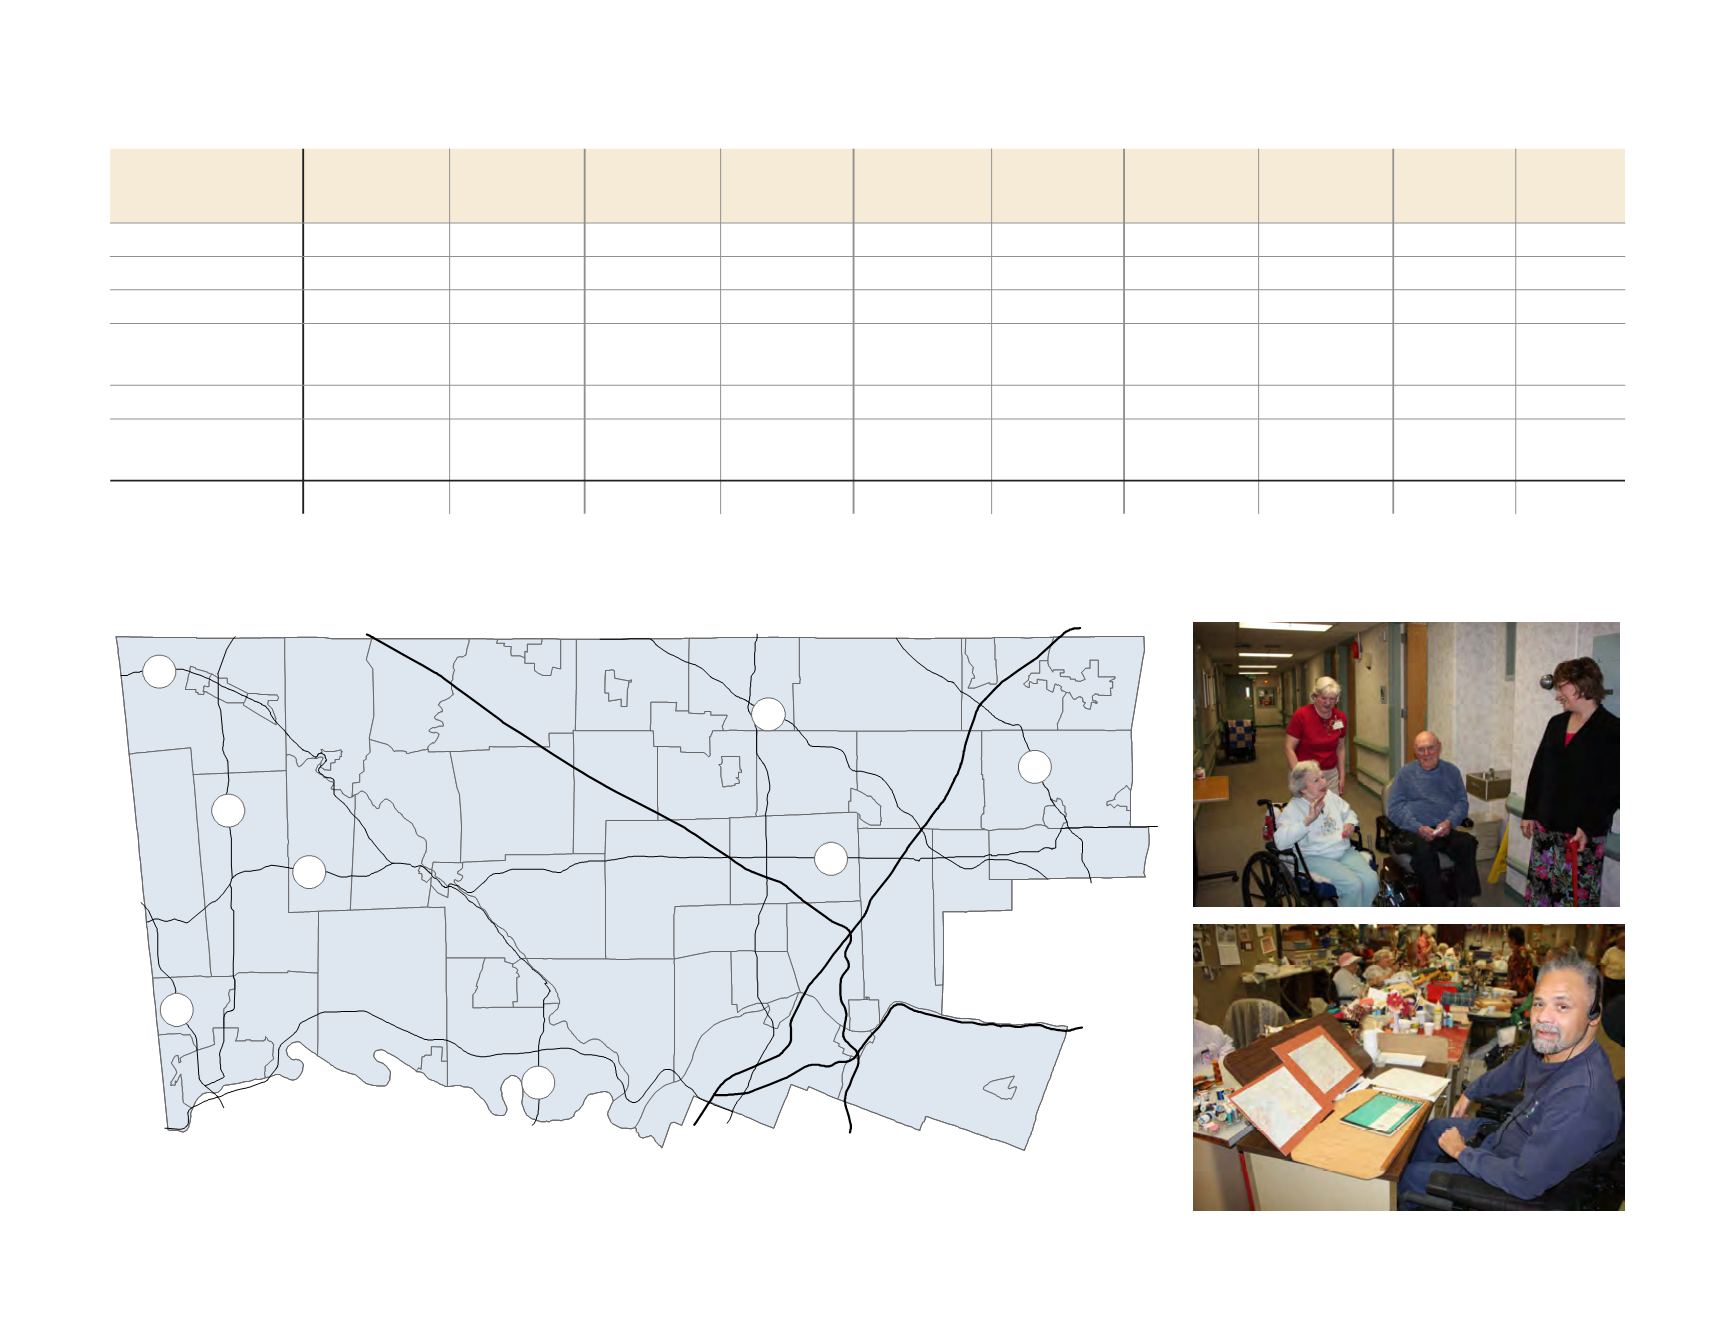
FIGURE 86:
Disabled Population
!
!
!
!
! !
!
!
!
!
!
! !
!
!
!
!
!
!
!
!
!
!
!
!
! !
!
!
!
!
!
!
!
¯
Pottstown
Norristown
Lansdale
Collegeville
Jenkintown
Conshohocken
476
276
76
476
t
u
422
t
u
202
611
100
309
Hatboro
Ambler
Pennsburg
73
663
29
29
73
!
Homeless Facilities
!
Residential Mental Health Facilities
!
Other Special Needs Residential Facilities
Source: U.S. Census Bureau
Source: Montgomery County Planning Commission


