montgomery county today
115
2 PERSON
HOUSEHOLD
4 PERSON
HOUSEHOLD
30% of Median Family Income*
$18,950
$23,850
Very Low Income
(Less than 50% of Median Family Income)
$31,550
$39,400
Low Income
(51-80% of Median Family Income)
$50,450
$63,050
FIGURE 83:
Government Subsidized Housing Income
Limits for Montgomery County (as of 2014)
*The FY 2014 Median Family Income for the Philadelphia MSA (which includes
Montgomery County) is $78,800. Source: U.S. Department of Housing and Urban
Development
PERCENT OF HOUSEHOLD
INCOME TOWARD
MONTHLY OWNER COSTS
HOUSEHOLDS
AS OF 2009
Less than 20%
35.3%
20.0—24.9%
16.7%
25.0—29.9%
13.8%
30.0—34.9%
9.5%
35.0% or more
24.6%
Not computed
0.2%
HOUSEHOLDS
AS OF 1999
32.4%
18.4%
15.8%
6.5%
16.3%
0.4%
FIGURE 81:
Selected Monthly Owner Costs as a
Percentage of Household Income in Montgomery County
FIGURE 82:
Countywide Sale Prices (in 2013 Dollars)
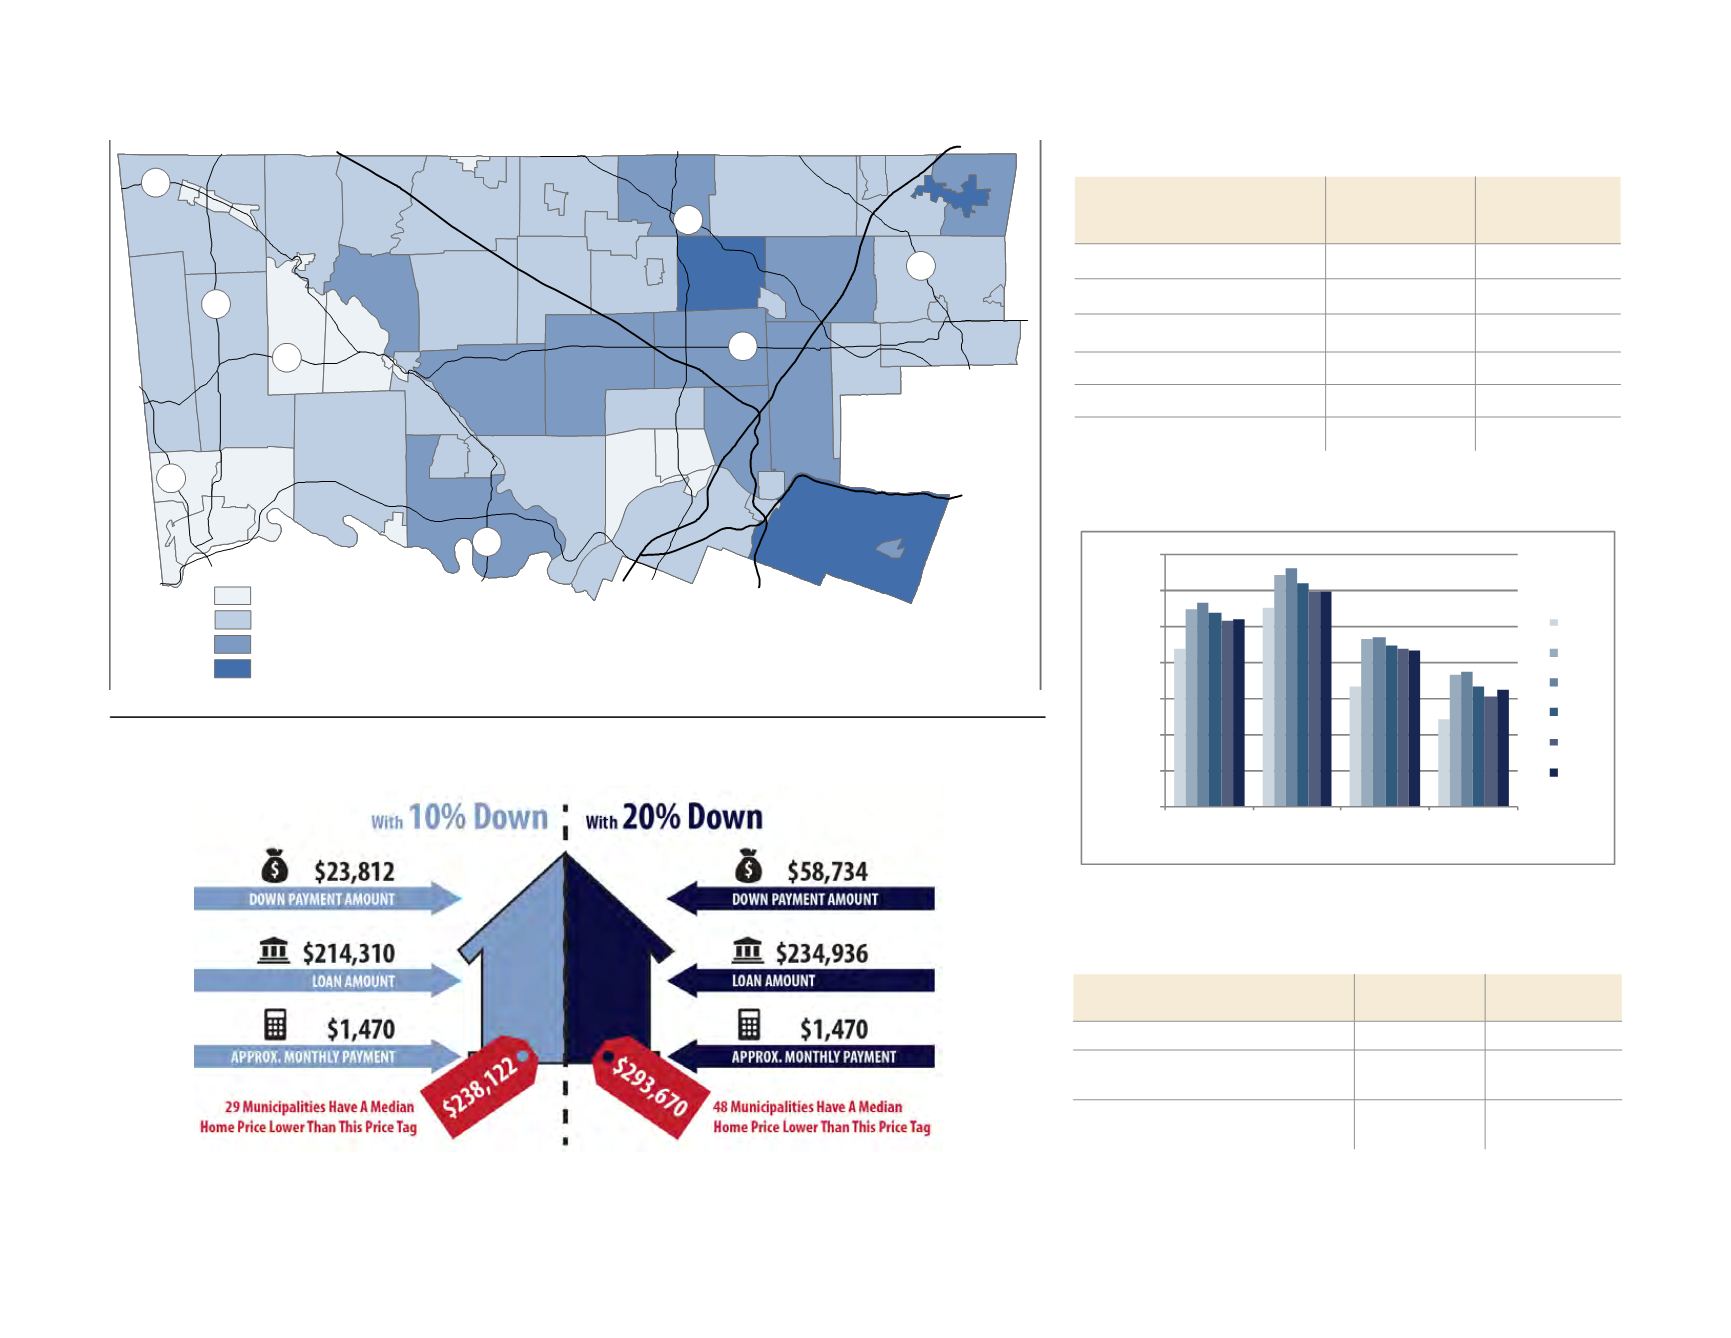
FIGURE 80:
Median Housing Sale Prices and Subsidized Housing Developments as of 2013
A household with the county’s median household income could conservatively afford to purchase:
This model assumes other costs such as outstanding auto or student loans, credit card and bill payments, as well as annual property taxes and mortgage
insurance costs. Found at:
/
Source: U.S. Census Bureau
Source: Montgomery County Planning Commission
!
!
!
!
! !
!
!
!
!
!
!
! ! !
!
!
!
!!! !
!
!
!
!
!
!
!
!
!
!
!
!
!
!
!
!
!
!
!
¯
Pottstown
Norristown
Lansdale
Collegeville
Jenkintown
Conshohocken
§¨
¦
476
§¨
¦
276
§¨
¦
76
§¨
¦
476
£
¤
422
£
¤
202
611
100
309
Hatboro
Ambler
Pennsburg
73
663
29
29
73
$200,000 or less
$200,001 - $300,000
$300,001 - $400,000
$400,001 or more
!
Subsidized housing developments
$0
$50,000
$100,000
$150,000
$200,000
$250,000
$300,000
$350,000
All Types Single-Family
Detached
Single-Family
Attached
Multifamily
2001
2009
2010
2011
2012
2013


