36
THE BUILT ENVIRONMENT
Land Use Changes: 1970 - 2010
In 1970, Montgomery County had three different types of
areas – residential suburban neighborhoods oriented to
Philadelphia, industrial concentrations with associated
towns, and rural farmland. At this time, a fourth type was
emerging – significant suburban industrial, office, and retail
development, with associated residences, that was not
directed towards Philadelphia. From 1970 to 2010, this
fourth type of development—independent suburban
development—has dominated new development in
Montgomery County.
Of course, not all new development takes place on
undeveloped land. Underutilized sites in urbanized areas are
increasingly targeted for redevelopment and adaptive reuse,
especially as the creation of new infrastructure slows.
Over the last five years, total land development has slowed
considerably. Residential and nonresidential development
fell to historically low levels after the housing bubble burst
and the Great Recession followed.
LAND USE
1970
2000
2010
Mobile Homes
100
547
600
Transportation
16,905
21,016
22,044
Utility
664
1,568
1,566
Retail
2,732
5,171
5,872
Office
541
5,087
5,648
Mixed Use
941
1,829
1,877
Institutional
8,273
11,851
13,015
Industrial
6,153
9,735
9,973
Mining
736
945
954
Recreation and Parkland Fields
9,975
15,994
16,806
Wooded
54,596
61,623
58,147
Vacant / Agriculture
144,443
59,714
49,617
Single Family Detached
42,297
75,340
80,345
Single Family Detached—Low Density
(< 1 unit/acre)
16,459
27,511
29,962
Single Family Attached
1,952
6,926
8,419
Multifamily
1,503
3,297
3,392
FIGURE 35:
Existing Land Use: 1970-2010
What’s New
•
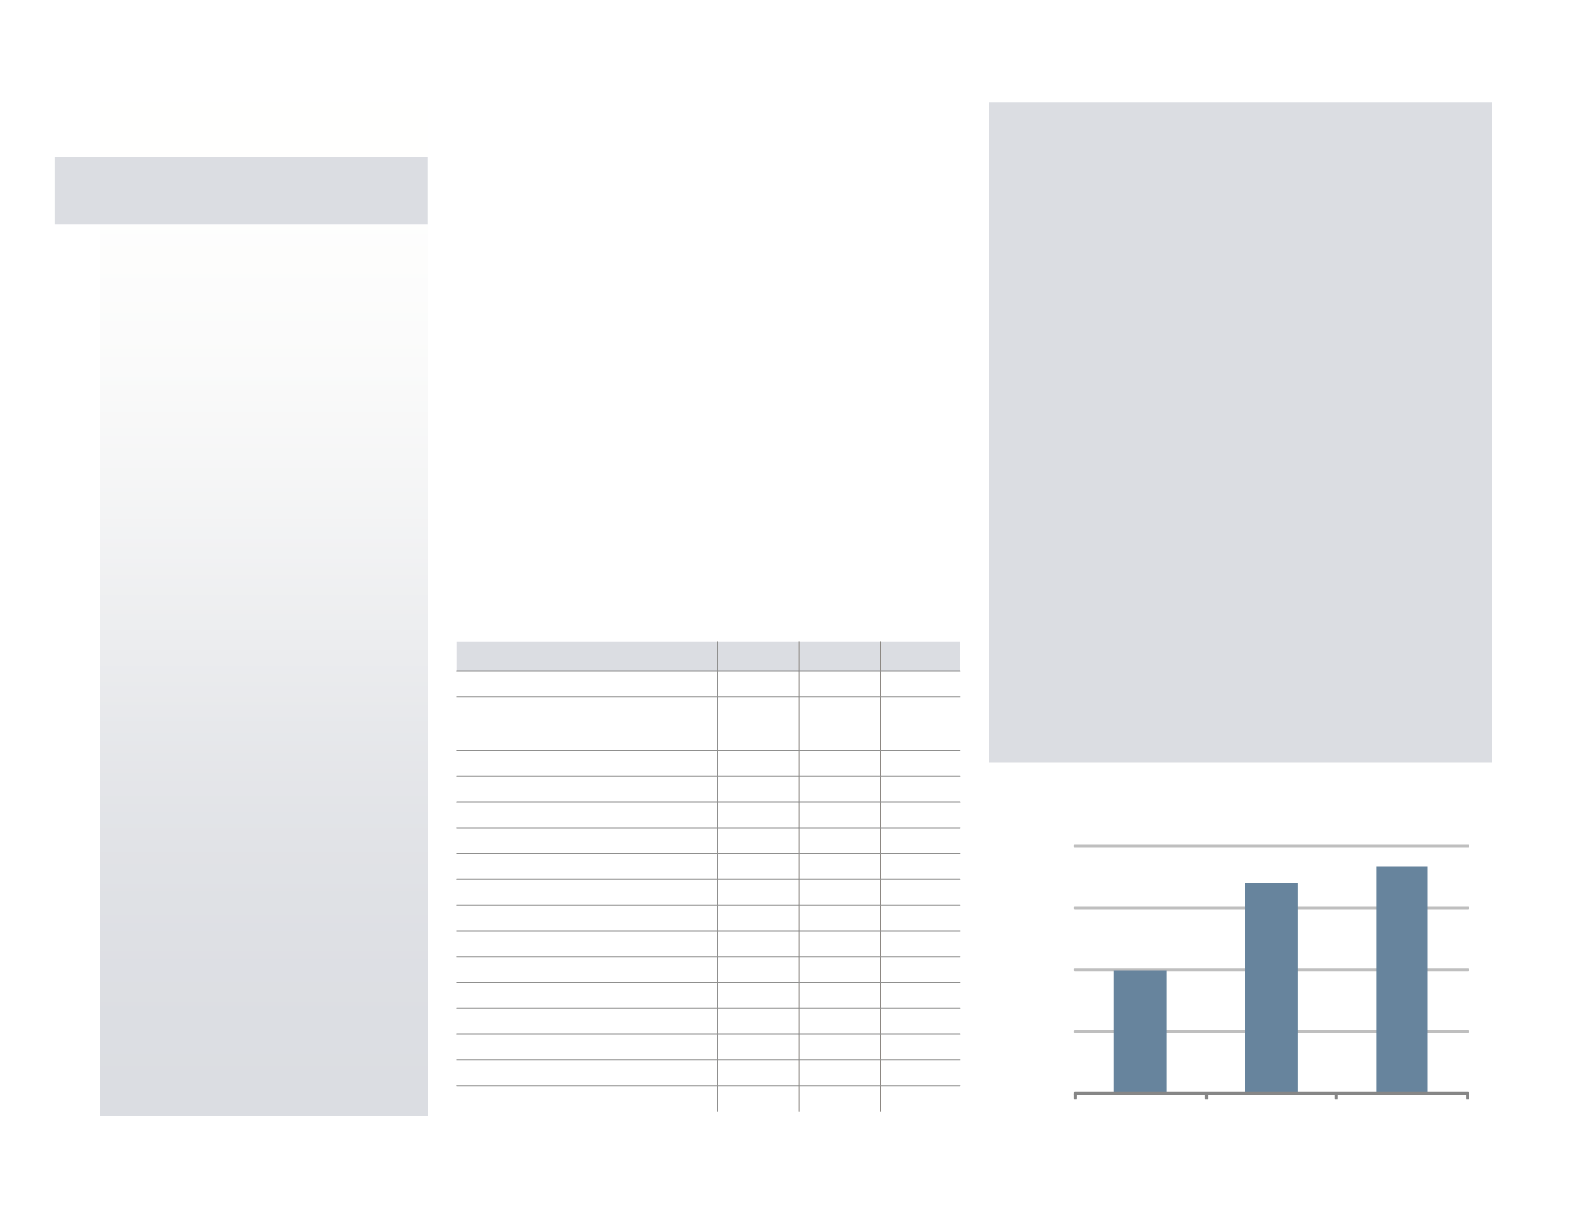
The county averaged 1,284 acres of newly developed
land per year from 2000 to 2010. The 2000 County
Comprehensive Plan was based on a goal of 1,000
newly developed acres per year through 2025 in or-
der to maintain the county’s quality of life. Howev-
er, population growth was more rapid than expected
during this past decade. Current projections show
that the county is still on target to develop no more
than 25,000 acres between 2000 and 2025.
•
Development over the last ten years has become
twice as efficient. From 1970 to 2000, new develop-
ment was added at a rate of 0.54 acres per person
added to the county. From 2000 to 2010, only 0.25
acres were added per additional person.
•
More than half of the residential units built since
2000 have been denser housing types such as town-
homes, condos, and apartments as opposed to single
family detached homes, which had dominated the
housing market in Montgomery County up to this
point. In 2000, there were 2.6 housing units for eve-
ry acre of residentially developed land. Between
2000 and 2010, there were 3.1 housing units added
for every acre of residential land developed over the
decade.
FIGURE 36:
Total Developed Acres: 1970-2010
Existing Land Use
Land Use Changes:
1970 - 2010
Regionally Significant Land Uses
Types of Landscapes
Land Use Trends
99,256
170,823
183,667
0
50,000
100,000
150,000
200,000
1970
2000
2010


