montgomery county today
143
DESCRIPTION
2012
JOBS
2015
JOBS
NUMBER
CHANGE
PERCENT
CHANGE
Arts, Entertainment and
Recreation
12,242
13,356
1,114
9%
Railroad Rolling Stock
Manufacturing
47
106
59
126%
Manufacturing and
Reproducing Magnetic and
Optical Media
164
324
160
98%
Other Pipeline
Transportation
42
64
22
52%
Educational Services
(Private)
19,563
20,596
1,033
5%
Health Care and Social
Assistance
72,789
76,396
3,607
5%
Professional, Scientific, and
Technical Services
69,910
72,891
2,981
4%
Management of Companies
and Enterprises
11,212
12,080
868
8%
Real Estate including Rental
and Leasing
28,543
30,438
1,895
7%
Finance and Insurance
51,707
55,063
3,356
6%
Wireless Telecommunications
Carriers
492
704
212
43%
Soap, Cleaning Compound
and Toilet Preparation
Manufacturing
395
547
152
38%
Gambling Industries
84
113
29
35%
Scenic and Sightseeing;
Transportation and Land
17
22
5
29%
Securities and Commodity
Exchanges
115
147
32
28%
Beverage Manufacturing
97
123
26
27%
Waste Collection
512
649
137
27%
FIGURE 110:
Industries Projected for Near Term Growth
Source: Montgomery County Workforce Investment Board, Local Plan July
1, 2012-June 30, 2017
¯
Pottstown
Norristown
Lansdale
Collegeville
Jenkintown
Conshohocken
476
276
76
476
t
u
422
t
u
202
611
100
309
Hatboro
Ambler
Pennsburg
73
663
29
29
73
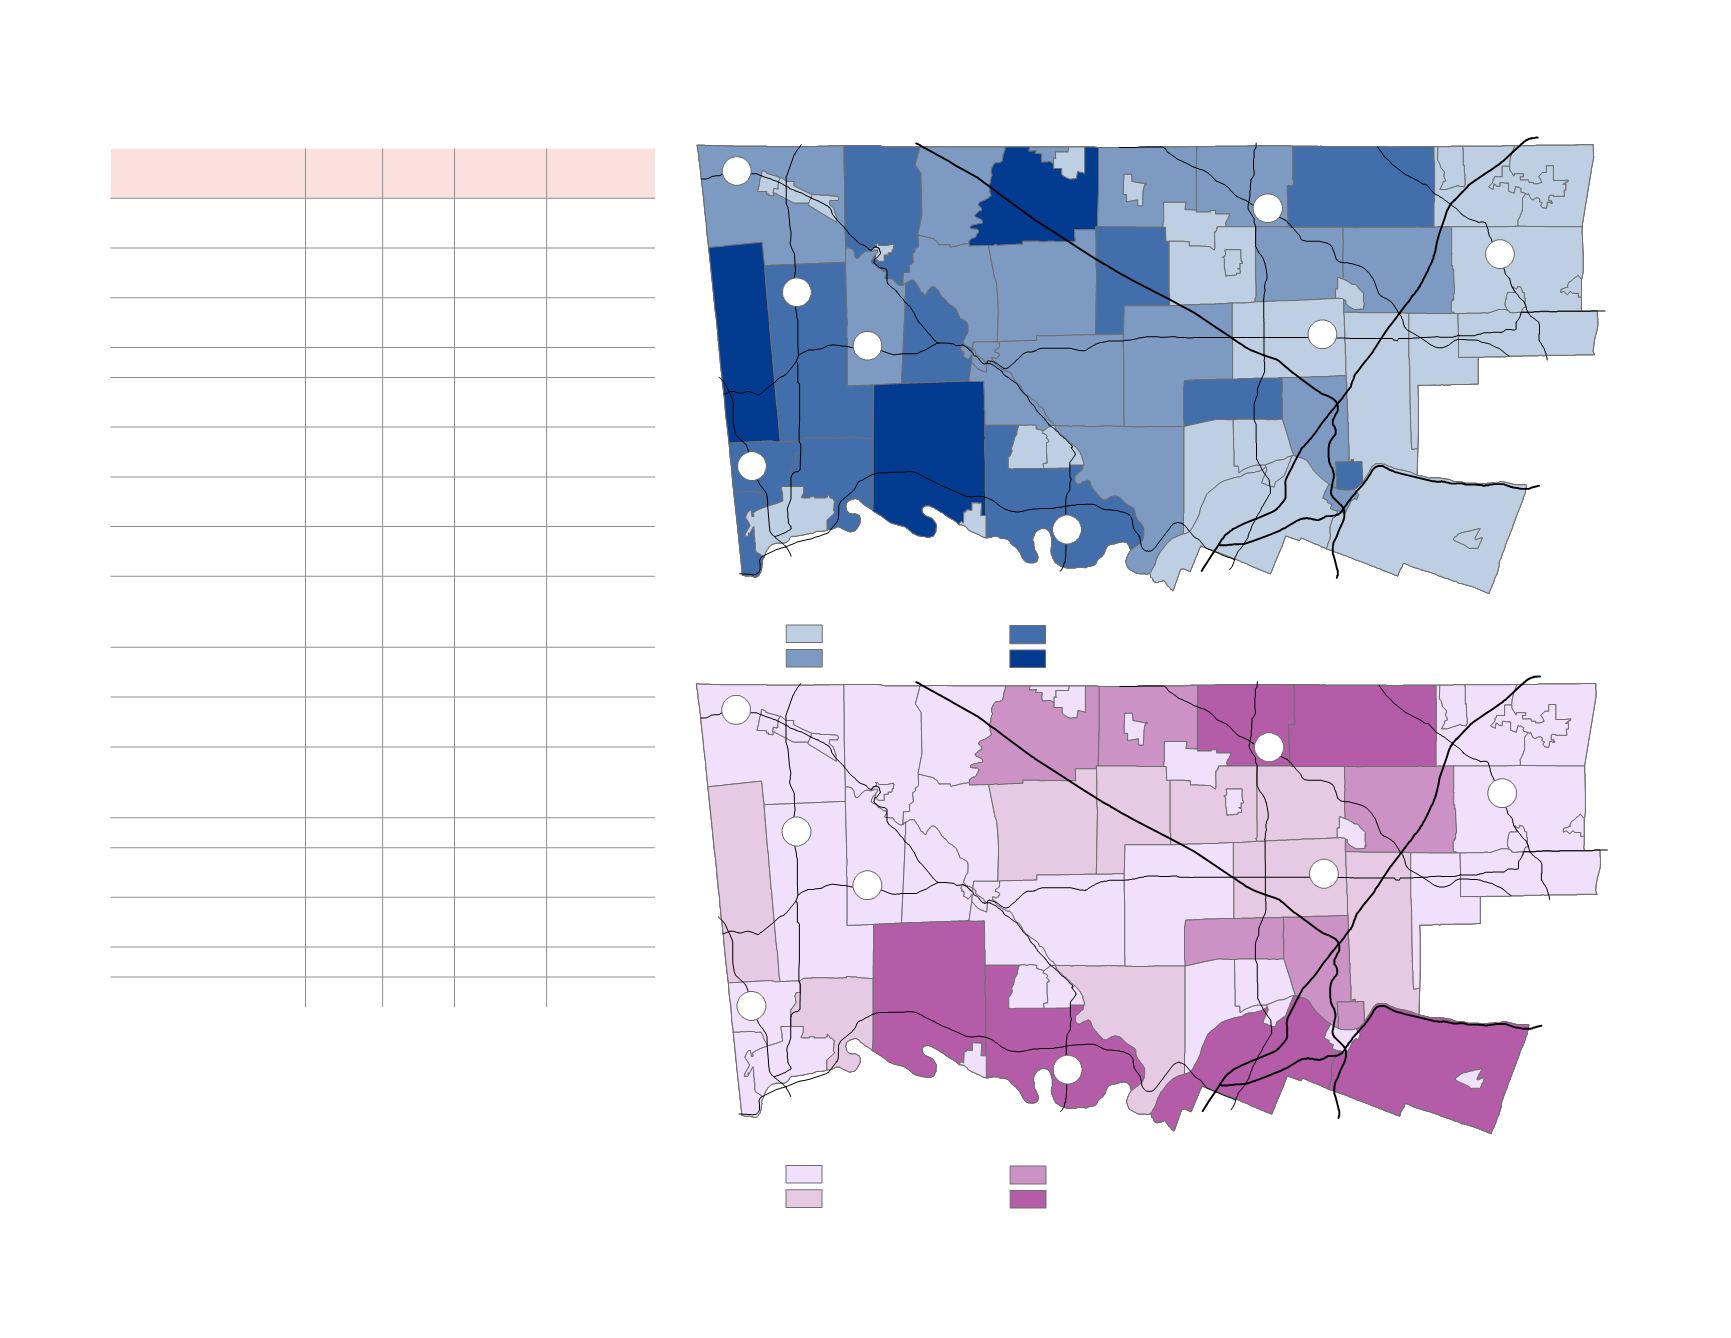
Less than 10%
10% - 19.9%
20% - 29.9%
30% and greater
Forecasted Employment Increases by Percent
FIGURE 111:
Forecasted Percent and Number Change in Employment Between 2010 and 2040
Source: Delaware Valley Regional Planning
Commission
Source: Delaware Valley Regional Planning
Commission
¯
Pottstown
Norristown
Lansdale
Collegeville
Jenkintown
Conshohocken
476
276
76
476
t
u
422
t
u
202
611
100
309
Hatboro
Ambler
Pennsburg
73
663
29
29
73
Less than 1000 jobs
1000 - 1999 jobs
2000 - 2999 jobs
3000 and more jobs
Forecasted Employment Increases by Number


